

October 16, 2026
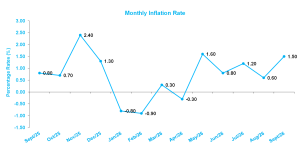
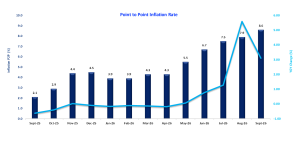
The Statistical Institute of Jamaica (STATIN) reported that as of September 2026, the point-to-point inflation rate was +8.6%, rising from the +7.9% rate recorded for the period August 2025 to August 2026. This is the highest rate recorded since December 2022. Compared to August 2026, the All-Jamaica Consumer Price Index (CPI) increased by 1.5% in September 2026, moving to 155.8 from 153.6.
The All-Jamaica CPI increased by 1.5% in September 2026, largely reflecting a 2.9% rise in the ‘Food and Non-Alcoholic Beverages’ division, driven primarily by higher prices for a range of agricultural produce, including tomato, carrot, lettuce, pumpkin, Irish potato and sweet potato. Also contributing was a 4.0% increase in the ‘Education’ division, on account of higher tuition fees for private primary schools for the new school term. In addition, the ‘Housing, Water, Electricity, Gas and Other Fuels’ division rose by 0.7%, due mainly to higher rental rates and electricity rates.
The All-Jamaica point-to-point inflation rate for the period September 2025 to September 2026 was 8.6%. The divisions contributing most to this outturn were ‘Transport’ (+14.6%), ‘Food and Non-Alcoholic Beverages’ (+12.4%), and ‘Housing, Water, Electricity, Gas and Other Fuels’ (+4.5%).
Within the ‘Food and Non-Alcoholic Beverages’ division, the largest impact came from a 26.8% increase in the ‘Vegetables, tubers, plantains, cooking bananas and pulses’ class, influenced by higher prices for green banana, plantain, yam, tomato, cabbage and carrot. The ‘Fruits and Nuts’ class rose by 25.6%, reflecting higher prices for ripe banana, orange, watermelon and dried coconut. Additional upward pressure came from the ‘Fish and Seafood’ class, which rose by 14.3%.
In the ‘Transport’ division, the 14.6% point-to-point increase was primarily attributable to a 15.4% rise in the ‘Passenger Transport Services’ group, due to increased route taxi and hackney carriage fares. Additionally, the ‘Fuels and Lubricants for Personal Transport Equipment’ class rose by 24.8%, reflecting higher petrol prices.
The 4.5% increase in the ‘Housing, Water, Electricity, Gas and Other Fuels’ division was mainly attributable to a 4.7% rise in the ‘Imputed Rentals for Housing’ group and a 6.0% increase in the ‘Actual Rentals for Housing’ group, alongside a 3.7% increase in the ‘Electricity, Gas and Other Fuels’ group.
MAJOR CPI DIVISION MOVEMENTS
The ‘Food and Non-Alcoholic Beverages’ division rose by 2.9%, with the ‘Food’ group increasing by 3.0% and the ‘Non-Alcoholic Beverages’ group rising by 0.4%. All classes within the division recorded increases. The sharpest movement within the ‘Food’ group was a 10.5% rise in ‘Vegetables, tubers, plantains, cooking bananas and pulses’, reflecting higher prices for agricultural produce such as tomato, carrot, lettuce, pumpkin, Irish potato and sweet potato. The ‘Fish and Seafood’ class increased by 1.3%, due mostly to higher prices for salted fish and salted mackerel, while ‘Fruits and Nuts’ rose by 1.8%, influenced by increased prices for watermelon, pineapple and orange. The rise in the ‘Non-Alcoholic Beverages’ group was primarily due to increases of 0.5% in ‘Water, Soft Drinks and Other Non-Alcoholic Beverages’ and in ‘Coffee, Tea, Cocoa’.
Point-to-point inflation rate: 12.4%
The index for ‘Alcoholic Beverages, Tobacco and Narcotics’ rose by 0.3%, resulting from a similar 0.3% increase in the ‘Alcoholic Beverages’ group, mainly attributable to higher prices for rums and wines.
Point-to-point inflation rate: 6.8%
The index for ‘Clothing and Footwear’ increased by 0.4%. The main contributor was a 0.4% rise in the ‘Clothing’ group, while the ‘Footwear’ group moved up by 0.3%.
Point-to-point inflation rate: 3.1%
The index for ‘Housing, Water, Electricity, Gas and Other Fuels’ rose by 0.7%. This was mainly attributable to a 0.7% rise in the ‘Imputed Rentals for Housing’ group, reflecting higher rental rates, and a 0.7% increase in the ‘Electricity, Gas and Other Fuels’ group due to higher electricity rates. These increases were partially offset by a 0.2% decline in the ‘Water Supply and Miscellaneous Services Relating to the Dwelling’ group, resulting from lower water supply and sewage rates.
Point-to-point inflation rate: 4.5%
The index for ‘Furnishings, Household Equipment and Routine Household Maintenance’ rose by 0.1%. Increases were recorded in ‘Tools and Equipment for House and Garden’ (+0.3%), ‘Furniture, Furnishings and Loose Carpets’ (+0.2%), ‘Household Textiles’ (+0.2%) and ‘Goods and Services for Routine Household Maintenance’ (+0.1%).
Point-to-point inflation rate: 3.3%
The ‘Health’ division increased by 0.2%, driven by a 0.2% rise in ‘Medicines and Health Products’, influenced by higher prices for some pain and prescription medicines. The ‘Outpatient Care Services’ group rose by 0.5%, reflecting increased fees charged by general practitioners.
Point-to-point inflation rate: 3.9%
The ‘Transport’ division recorded a 0.3% increase, influenced by a 1.4% rise in the ‘Operation of Personal Transport Equipment’ group, due primarily to higher petrol prices.
Point-to-point inflation rate: 14.6%
The ‘Recreation, Sport and Culture’ division increased by 0.2%, largely attributable to a 0.2% rise in ‘Newspapers, Books and Stationery’, resulting from increased prices for school books and stationery items.
Point-to-point inflation rate: 3.2%
The ‘Education’ division rose by 4.0%, attributable entirely to higher tuition fees for private schools at the primary level.
Point-to-point inflation rate: 6.4%
The ‘Personal Care, Social Protection and Miscellaneous Goods and Services’ division increased by 0.2%, resulting mainly from increased prices for personal care products and personal grooming services.
Point-to-point inflation rate: 4.3%
Individual Divisional Monthly Changes — September 2026
• Food and Non-Alcoholic Beverages: (+2.9%)
• Alcoholic Beverages, Tobacco and Narcotics: (+0.3%)
• Clothing and Footwear: (+0.4%)
• Housing, Water, Electricity, Gas and Other Fuels: (+0.7%)
• Furnishings, Household Equipment and Routine Household Maintenance: (+0.1%)
• Health: (+0.2%)
• Transport: (+0.3%)
• Recreation, Sport and Culture: (+0.2%)
• Education: (+4.0%)
• Personal Care, Social Protection and Miscellaneous Goods and Services: (+0.2%)
Disclaimer:
Analyst Certification – The views expressed in this research report accurately reflect the personal views of Mayberry Investments Limited Research Department about those issuer (s) or securities as at the date of this report. Each research analyst (s) also certify that no part of their compensation was, is, or will be, directly or indirectly, related to the specific recommendation (s) or view (s) expressed by that research analyst in this research report.
Company Disclosure – The information contained herein has been obtained from sources believed to be reliable, however its accuracy and completeness cannot be guaranteed. You are hereby notified that any disclosure, copying, distribution or taking any action in reliance on the contents of this information is strictly prohibited and may be unlawful. Mayberry may affect transactions or have positions in securities mentioned herein. In addition, employees of Mayberry may have positions and effect transactions in the securities mentioned herein.