

October 1, 2026
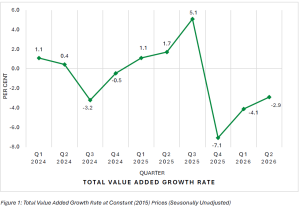
The Statistical Institute of Jamaica (STATIN) reported a 2.9% decline in Jamaica’s total value added in the second quarter (April–June) of 2026 compared with the same quarter of 2025. Real value added fell to $420.9 billion from $433.4 billion. Both major groups contracted: the Goods Producing Industries fell 6.3% and the Services Industries fell 1.8%.
This is the third straight quarter of year-over-year decline since Hurricane Melissa, but each decline has been smaller than the last: -7.1% in Q4 2025, -4.1% in Q1 2026 and -2.9% in Q2 2026. Dry conditions across most parishes, the lingering effects of the hurricane and a sharp drop in visitor arrivals continued to weigh on output.
Goods Producing Industries
The 6.3% contraction was driven by Agriculture, Forestry & Fishing (-15.3%) and Mining & Quarrying (-26.1%). Manufacturing (+0.1%) and Construction (+0.4%) posted small gains.
Agriculture was hurt by drought and hurricane after-effects. The Growing of Fruits sub-group fell 55.6%, led by declines of 72.0% in banana production and 77.5% in plantain production. Yams and other root crops fell 16.3% as the area reaped dropped 11.7%, although potato output rose 16.9%. Vegetables and condiments fell 4.6% on lower output of tomatoes, sweet peppers and hot peppers. Growth in Other Crops and Animal Production helped moderate the overall decline.
Mining & Quarrying fell on lower bauxite and alumina output. Total bauxite production fell 16.1% to 1,317,644 tonnes. Alumina production fell 30.8% to 251,933 tonnes, and alumina exports fell 32.2% to 268,081 tonnes. Crude bauxite was a bright spot: production rose 8.8% to 513,957 tonnes and exports rose 5.4% to 503,938 tonnes.
Manufacturing edged up 0.1%. Other Manufacturing grew 7.1%, mainly because Non-Metallic Mineral Products, especially cement, rose 40.8%. This was partly offset by a 19.6% fall in Refined Petroleum Products, as the refinery had fewer operating days, and a 0.6% dip in Chemicals. Food, Beverages & Tobacco fell 3.8%, with lower output of dairy, oils and fats, grain milling, animal feeds and beverages.
Construction grew 0.4%, supported by government-led civil engineering capital spending, higher sales of construction materials and increased construction lending by commercial banks.
Services Industries
The Services Industries fell 1.8%, with declines in most sectors.
The steepest contraction was in Accommodation & Food Service Activities (-12.3%). Foreign national arrivals fell 21.0%, from 691,796 to 546,413, and some hotels remained closed. Transport & Storage declined 6.1% as tourism-related travel weakened, and airport passenger traffic fell 15.1%. Electricity, Water Supply & Waste Management fell 4.2%: electricity consumption dropped 2.4% to 812,917 MWh and water consumption fell 7.5% to 4,410.6 million gallons.
Real Estate & Business Activities fell 3.7%, mainly on weaker business process outsourcing, equipment leasing and accounting services. The Real Estate sub-industry itself grew 1.6%. Information & Communication declined 1.5% because of hurricane after-effects and the continued shift of advertising away from traditional platforms. Education, Health & Other Services fell 1.3%, reflecting lower activity at amusement parks, beaches and recreation parks, as well as in betting and gaming. Stopover arrivals fell 19.4% and cruise passenger arrivals fell 6.8%.
Three sectors grew. Financial & Insurance Activities rose 3.0% on higher commercial bank net interest income and fees. Wholesale & Retail Trade grew 0.6%, helped by construction activity and petroleum distribution, though weaker employment held back demand. Public Administration & Defence rose 0.3%.
Quarter-over-Quarter Performance
On a seasonally adjusted basis, real value added rose 1.2% compared with January–March 2026. This was the second consecutive quarter of growth, following a 3.0% increase in Q1. The Goods Producing Industries grew 1.7%, led by Agriculture (+5.1%), Construction (+1.1%) and Manufacturing (+0.7%), while Mining & Quarrying fell 10.2%. The Services Industries grew 1.0%. Accommodation & Food Services led with 8.2%, followed by Electricity & Water (+2.8%), Transport & Storage (+1.8%), Financial & Insurance (+1.3%), Public Administration (+0.9%), Information & Communication (+0.5%) and Wholesale & Retail (+0.4%). Real Estate & Business Activities (-0.5%) and Education, Health & Other Services (-0.1%) declined.
Even with this recovery, seasonally adjusted output of $424.0 billion remains about 3.3% below the pre-hurricane level of $438.7 billion in Q3 2025.
Fiscal Year and Nominal Context
For fiscal year 2025/26 (April–March), real value added totalled $1.70 trillion, down about 1.2% from 2024/25. In current prices, GDP at market prices for Q2 2026 was $908.1 billion, compared with $878.4 billion in Q2 2025.
(Source: STATINJA)
Disclaimer:
Analyst Certification -The views expressed in this research report accurately reflect the personal views of Mayberry Investments Limited Research Department about those issuer (s) or securities as at the date of this report. Each research analyst (s) also certify that no part of their compensation was, is, or will be, directly or indirectly, related to the specific recommendation (s) or view (s) expressed by that research analyst in this research report.
Company Disclosure -The information contained herein has been obtained from sources believed to be reliable, however its accuracy and completeness cannot be guaranteed. You are hereby notified that any disclosure, copying, distribution or taking any action in reliance on the contents of this information is strictly prohibited and may be unlawful. Mayberry may effect transactions or have positions in securities mentioned herein. In addition, employees of Mayberry may have positions and effect transactions in the securities mentioned herein.