

August 14, 2026
Sterling Investments Limited (SIL)
Unaudited financials for the six months ended June 30, 2026
Sterling Investments Limited (SIL) for the six months ended June 30, 2026, reported interest income calculated using the effective interest method of $63.53 million, a 6% decrease compared to $67.45 million in the corresponding period last year. Interest income for the second quarter closed at $30.48 million (2025: $32.86 million).
Foreign exchange results swung to a loss of $17.95 million (2025: gain of $49.40 million), as the Jamaican dollar’s appreciation in the first six months of 2026 contrasted with the 1.77% depreciation experienced in the same period of 2025. Management noted that short-term currency movements will create volatility in top-line revenue. Net gain on the sale of debt investment securities at FVOCI improved to $13.09 million (2025: $10.05 million), while the Company recorded a one-time net loss of $34.70 million on the sale of equity investment securities at FVTPL, reflecting a strategic decision to reposition the portfolio. As a result, total revenue for the period declined to $23.97 million (2025: $126.90 million).
The turnaround in profitability was driven below the revenue line. Fair value gain on securities at FVTPL amounted to $125.95 million, a sharp reversal from the $11.68 million loss booked in the prior-year period, largely reflecting a recovery in the fair value of securities held at fair value through profit or loss.
Interest expense declined by 23% to $5.75 million (2025: $7.44 million), while other operating expenses rose to $30.71 million (2025: $24.64 million).
Consequently, Profit before Taxation for the six months ended June 30, 2026, increased by 37% to $113.50 million, compared to $82.72 million in the prior year.
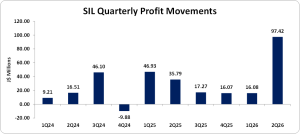
With no taxation charge, Net Profit for the period totalled $113.50 million (2025: $82.72 million). Net Profit for the second quarter amounted to $97.42 million, a substantial increase over the $35.79 million reported in the comparable quarter of 2025, driven largely by the $115.88 million quarterly fair value gain on FVTPL securities.
Total other comprehensive loss for the period was $35.92 million (2025: income of $11.46 million), driven mainly by a $41.79 million negative change in the fair value of FVOCI debt instruments. As such, Total Comprehensive Income for the period was $77.58 million (2025: $94.18 million).
Consequently, Earnings Per Share for the six months amounted to $0.21 (2025: EPS: $0.16), while Earnings Per Share for the second quarter totalled $0.18 (2025: EPS: $0.07). The twelve-month trailing EPS was $0.28, and the number of shares used in these calculations was 527,947,931.
Notably, SIL’s stock price closed the trading period on August 13, 2026, at a price of $3.20 with a corresponding P/E ratio of approximately 11.68x.
Balance Sheet Highlights
The Group’s total assets totalled $2.24 billion (2025: $1.73 billion), representing a 29.43% increase. This partially reflects management’s decision to take advantage of bond price volatility and add high-quality, discounted assets to the portfolio.
Total liabilities increased by 42.23% to $247.89 million (2025: $174.29 million), primarily the result of increases in the margin loan payable that outweighed the approximately 50% decrease in other payables and due-to-related-group line items.
Total equity increased to $1.99 billion as at June 30, 2026, from $1.55 billion at June 30, 2025, a 27.99% increase, representing a book value per share of $3.77 (2025: $2.94). The increase was due primarily to a substantial inflow of capital at the end of June through the Complementary Share Purchase Programme (CSPP); these funds will be used to expand the investment portfolio, diversify holdings and increase exposure to international equities. Annualised return on the closing equity base was approximately 11.4%. Management indicated the portfolio is well-positioned to take advantage of market volatility, with liquidity available and leverage below internal limits, while cautioning that the process is unlikely to be linear.
DISCLAIMER
Analyst Certification – This research report is for information purposes only and should not be construed as a recommendation. Each research analyst (s) also certify that no part of their compensation was, is, or will be, directly or indirectly, related to the specific recommendation (s) or view (s) expressed by that research analyst in this research report.
Company Disclosure – The information contained herein has been obtained from sources believed to be reliable, however its accuracy and completeness cannot be guaranteed. You are hereby notified that any disclosure, copying, distribution or taking any action in reliance on the contents of this information is strictly prohibited and may be unlawful. Mayberry may effect transactions or have positions in securities mentioned herein. In addition, employees of Mayberry may have positions and effect transactions in the securities mentioned herein.