
June 1, 2026
Wigton Energy Limited (WIG)
Audited financials for the twelve months ended March 31, 2026:
Wigton Energy Limited (WIG), for the twelve months ended March 31, 2026, reported a 6% increase in Sales, totalling $1.96 billion compared to $1.85 billion in the corresponding period last year.
Cost of sales amounted to $1.01 billion (2025: $858.67 million), representing a 17% increase year over year. Consequently, gross profit decreased by 4% to $955.84 million compared to $993.10 million for the twelve months ended March 31, 2025.
Other Income declined by 19% to close at $405.89 million (2025: $499.24 million), while general administrative expenses increased by 6% from $777.86 million in 2025 to $826.04 million in the period under review.
Consequently, operating profit for the twelve months ended March 31, 2026 amounted to $535.69 million, a 25% decrease relative to $714.47 million reported in 2025. Finance Expense totalled $292.61 million, representing a 16% decrease from $349.20 million reported in 2025. Additionally, share of net profit of associate amounted to $3.07 million (2025: Loss of $4.89 million).
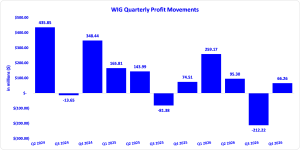
Profit before taxation for the twelve months ended March 31, 2026 amounted to $246.16 million, a 32% decrease relative to $360.39 million reported in 2025.
The tax charge incurred for the twelve months ended March 31, 2026, amounted to $37.65 million (2025: $57.46 million). Net Profit for the twelve months amounted to $208.51 million, a 31% decrease from the $302.93 million reported in 2025.
Other Comprehensive Income totalled $1.60 million (2025: loss of $84.52 million). As a result, Total Comprehensive Income for the twelve months amounted to $210.10 million, compared to $218.41 million in 2025.
Consequently, Earnings Per Share for the twelve months amounted to $0.02 (2025: EPS: $0.03). The number of shares used in these calculations was 11,000,000,000.
Notably, WIG’s stock price closed the trading period on May 29, 2026 at a price of $1.21 with a corresponding P/E ratio of 63.83x.
Balance Sheet Highlights
The company’s assets totalled $8.99 billion (2025: $9.67 billion), reflecting a 7% decline year over year. This movement in total assets was largely driven by a $378.98 million decline in Property, Plant and Equipment (2025: $5.04 billion), alongside reductions in receivables and restricted cash balances.
Shareholders’ equity stood at $5.50 billion (2025: $5.32 billion), representing a 3% increase year over year. This translated to a book value per share of $0.50 (2025: $0.48).
Disclaimer:
Analyst Certification -The views expressed in this research report accurately reflect the personal views of Mayberry Investments Limited Research Department about those issuer (s) or securities as at the date of this report. Each research analyst (s) also certify that no part of their compensation was, is, or will be, directly or indirectly, related to the specific recommendation(s) or view (s) expressed by that research analyst in this research report.
Company Disclosure -The information contained herein has been obtained from sources believed to be reliable, however its accuracy and completeness cannot be guaranteed. You are hereby notified that any disclosure, copying, distribution or taking any action in reliance on the contents of this information is strictly prohibited and may be unlawful. Mayberry may effect transactions or have positions in securities mentioned herein. In addition, employees of Mayberry may have positions and effect transactions in the securities mentioned herein.


