
May 12, 2026
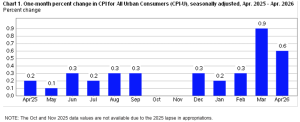
The U.S. Bureau of Labor Statistics reported that the Consumer Price Index for All Urban Consumers (CPI-U) increased 0.6% on a seasonally adjusted basis in April 2026, after rising 0.9% in March. Over the past 12 months, the all items index rose 3.8% before seasonal adjustment — matching the consensus on the monthly print but coming in 0.1 percentage point above the 3.7% Dow Jones consensus on the annual reading, and accelerating from March’s 3.3% pace to the highest annual increase since May 2023.
The shelter index rose 0.6% on a month-on-month basis, materially above March’s 0.3% increase, and reasserted itself as a major contributor to the monthly rise alongside energy. Core goods inflation remained subdued at the headline level, though apparel firmed with a 4.2% year-on-year gain. Core services (excluding energy) returned as the primary driver of underlying inflationary pressures, with services less energy services rising 0.5% on the month and 3.3% over the year.
The energy component remained a meaningful force in April, though less dominant than in March. Energy rose 3.8% on the month, accounting for over forty percent of the monthly all items increase. Gasoline prices climbed 5.4% on a seasonally adjusted basis and 11.1% on an unadjusted basis, while electricity rose 2.1% and fuel oil increased 5.8%. Over the 12 months ending April, the energy index increased 17.9% and gasoline rose 28.4%, reflecting continued spillover from the Iran conflict and disruptions to global oil flows.
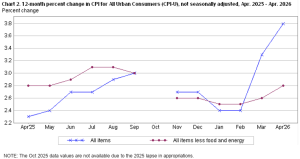
Excluding food and energy, core CPI increased 2.8% year-on-year in April, above March’s 2.6% reading, and slightly hotter than the 2.7% Barclays forecast. On a seasonally adjusted monthly basis, core CPI rose 0.4%, double the 0.2% pace seen in each of the prior two months, signalling that pass-through from elevated energy costs and underlying services pressures is beginning to broaden. The acceleration was reinforced by household furnishings and operations (+0.7% m/m), airline fares (+2.8% m/m), personal care (+0.7%), and apparel (+0.6%), partially offset by declines in new vehicles, communication, and medical care.
For the 12 months ending in April, the all items less food and energy index rose 2.8%. The shelter index increased 3.3% year-on-year — a re-acceleration from March’s 3.0% reading — with both owners’ equivalent rent up 3.3% and rent of primary residence up 2.8%. The monthly shelter print incorporated one-off adjustments to rent and OER indices to make up for the shortfall from the government shutdown last fall, complicating the read on the underlying shelter softening trend. Airline fares rose 20.7% year-on-year, and notably, real average hourly wages slipped 0.5% for the month and fell 0.3% annually — the first time in three years that inflation has eaten up all wage gains, raising concerns about consumer purchasing power going forward.
Disclaimer:
Analyst Certification – The views expressed in this research report accurately reflect the personal views of Mayberry Investments Limited Research Department about those issuer (s) or securities as at the date of this report. Each research analyst (s) also certify that no part of their compensation was, is, or will be, directly or indirectly, related to the specific recommendation(s) or view (s) expressed by that research analyst in this research report.
Company Disclosure – The information contained herein has been obtained from sources believed to be reliable, however its accuracy and completeness cannot be guaranteed. You are hereby notified that any disclosure, copying, distribution or taking any action in reliance on the contents of this information is strictly prohibited and may be unlawful. Mayberry may effect transactions or have positions in securities mentioned herein. In addition, employees of Mayberry may have positions and effect transactions in the securities mentioned herein.


